Why the Best CDs Are Often the Cheapest
How Demand and Availability Drive Used CD Prices
Statistical Analysis of Real-World Discogs & Rate Your Music Data - December 2025
Abstract
What determines the price of a used CD? Most collectors have a common sense set of assumptions that include album popularity, artist reputation and rarity. But these beliefs are rarely, if ever, tested using real data. The availability of several online data resources now makes it possible to determine which variables actually drive the price of used CDs.
In this study, publicly available data from two websites, Discogs and Rate Your Music (RYM), were analyzed to identify which variables correlate with used CD prices. Two artists with relatively long discographies, but with contrasting fan bases and music genres, were selected as test cases: Prince and R.E.M. Data including sold prices, various measurements of demand, availability, album reputation, number of releases, and age were obtained from these sources.
The analysis shows that CD prices are largely explained by two factors: demand relative to ownership (the want/have ratio from Discogs), and long-term availability (the number of releases of an album as shown in RYM). Together these two variables explain about 75% of the variation in price. Surprisingly, album reputation, as measured by user ratings, does not independently impact price. In fact, many highly regarded albums are less expensive because they were manufactured in larger quantities.
An additional nuance is that there is a difference between the immediate availability (copies currently for sale) versus long-term availability (represented by documented releases of an album). The latter appears to be a better indicator of the total number of copies that exist and therefore has a stronger relationship to price.
Introduction
In the used record store, or at any of the many online marketplaces, CDs usually do not sell for a fixed price. The price is set by the seller, often referring to Discogs or eBay completed sales, but also shaped by beliefs about desirability, scarcity, or reputation. Typically the price is only a few dollars, but some highly prized discs can sell for much more. CD collectors often apply reasonable logic when estimating value, but what does the data indicate is actually related to sold prices?
CD collectors are always looking for ways to better understand their collection and the broader market. Often relying on informal rules of thumb, such as the idea that better albums or more popular artists are worth more, which are believed but not tested. Going into this work I shared many of those thoughts, feeling that supply and demand was critical, but also that quality rating of a given album, or which artist made a given album might also play an important role.
There is no shortage of online commentary on CD desirability and pricing, but little of that is based on hard numbers. In many fields, relationships like these are examined by analyzing data rather than relying on intuition. Applying that approach to CDs will help clarify what does and does not affect CD prices.
The main question of this analysis is whether CD prices are driven primarily by supply and demand or whether factors such as album reputation, artist identity, or age of the release play additional independent roles. With the data collected here it is possible to test these ideas directly rather than relying on intuition.
The results reveal several interesting patterns. First, CD prices are strongly associated with demand and the long-term availability of an album. Second, the analysis suggests an important distinction between short-term availability, meaning how many copies are currently for sale, versus long-term availability, meaning how many copies were likely produced over the lifetime of the release. Finally, and perhaps most surprisingly, album quality, as measured by user ratings, does not independently increase price once supply is taken into account.
Data and selection criteria
Deciding what data to use in this type of analysis is an important step. I have not downloaded a giant dataset. The information was manually collected, so it was necessary to limit the scope to something manageable. Real-world data can be “messy” and may include points that are not representative (for example deluxe releases shouldn’t be compared to standard releases). So these points were removed when identified.
To evaluate whether the artist, treated as an input variable, is itself a significant factor, two popular and influential artists from the same era were selected, Prince and R.E.M. They have different musical styles and different patterns of ongoing archival releases (the Prince estate continues to release new material). Another difference is R.E.M. is a band, while Prince, despite working extensively with his own groups and collaborators throughout his career, is primarily perceived as a solo artist.
An important consideration is that both artists have relatively large discographies which provide more data points (a total of 50 albums across the two artists) for analysis and leads to a more robust result. Selecting contrasting examples also increases the likelihood that the analysis will detect meaningful differences should they exist. Obviously there are other factors relating to artist that this selection will not test, for example a lesser known versus well known artist, or more extreme genre differences, like classical music versus rock, but that is beyond the scope of this study.
RYM was used to generate a standard discography, using their list of studio albums. The site allows for display of an artist’s complete discography by album, live album, singles, etc. For this project only album discography was used. In addition to artist and title RYM provides a rating based on the average of user ratings on a 1-5 scale (5 is best). This is used to tell us the reputation of an album, or put another way a consensus of how good a particular album is. RYM also provides year of original release, number of people who rated, number of people who wrote reviews for the site, and “issues” which is the number of distinct releases and formats of an album, including releases from different countries and different formats. While this does not directly represent the number of CDs produced, it appears to be a proxy for overall supply, or as I describe it long-term availability, in contrast to total copies for sale, which is short-term availability.
Once a list of albums was generated, Discogs was used to get price data. Prior to doing that, standardized guidelines had to be created to get the highest quality and most usable data possible.
For each title the data was filtered to show only CDs and only US pressings. For most CDs Discogs lists many more versions or pressings than the RYM issues count. This is due to minor differences including the factory that manufactured the CD, or whether the CD is a record club release. In this analysis all these differences are ignored and data for each album is consolidated. Because some albums had dozens of minor variations, sales information was recorded only for the top five examples (as determined by number for sale) of each album. For this analysis, short term availability was calculated by summing copies for sale across the five CD versions with the highest number of copies for sale for each album. Other variables recorded were median sales price, users reporting “have” and users reporting “want”. Also, importantly, the ratio of the number of want to have was analyzed as a separate variable. Deluxe, box sets, rare early pressings (targets, longboxes), recent remasters, for example from the Prince estate, were excluded. Remasters up to 2005 were included if not also in one of the other excluded categories.
To summarize, for Discogs the following data was used: total copies for sale, total number of have and want, as well as the ratio want/have, and the median of the sold prices.
The analysis does not account for condition, or other factors not specifically mentioned below. Median sold price is intended to average over these effects.
And from RYM the following data was used: album rating, count of users who rated, count of users who reviewed, count of issues (e.g. releases of the album).
The table below shows the variables, their source, as well as a brief description of what the variable is intended to be measuring which explains why it is included.
| Variable | Source | Description | Intended meaning |
|---|---|---|---|
| Median sold price | Discogs | Median of recent sold prices for the top five CD versions (as determined by number for sale) | Market price of the album |
| Copies for sale | Discogs | Count of copies currently listed for sale across selected CD versions | Short term availability |
| Have count | Discogs | Count of users reporting ownership of the album | Ownership prevalence |
| Want count | Discogs | Count of users reporting a desire to own the album | Unmet demand |
| Want/Have ratio | Discogs | Ratio of want count to have count | Demand imbalance |
| Album rating | RYM | Average user rating on a 1-5 scale | Album reputation or perceived quality |
| Count of ratings | RYM | Count of user ratings submitted | Breadth of audience engagement |
| Count of reviews | RYM | Count of written user reviews | Depth of engagement |
| Count of issues | RYM | Count of distinct releases and formats listed | Proxy for long-term availability |
| Album age | RYM | Years since original album release |
Price uses a median (the middle value) instead of the average since otherwise very high or low individual values could have undue influence on the results.
To calculate how the different factors relate to price, a statistical technique called multiple regression is used. The method looks at all the variables at the same time and figures out which ones best explain the sold price.
It is important to realize that in addition to determining which variables help explain differences in price, the analysis also shows which variables do not.
The regression model relates sold price to demand imbalance (want/have ratio) and long-term availability (number of issues), along with other variables representing album reputation, listener engagement, album age, and artist.
Results
The statistical analysis evaluates how each collected variable relates to sold price.
Of the factors examined, two clearly dominate in their relationship to sold price: the ratio of want/have indicated by Discogs, and the number of issues as indicated by RYM. In statistical terms these variables are highly significant, which means that the results would not occur by random variation or chance in the data. These variables are proxies for demand (perhaps better described as demand imbalance) and long-term availability. Other evaluated variables which are also proxies for demand or availability are related to sold price, but more weakly.
The higher the want/have ratio, the higher the sold price. While this was expected, the data clearly demonstrates the strength of the relationship.
The higher the number of issues reported by RYM, the lower the sold price. This likely occurs because more popular albums are released in higher numbers, resulting in higher supply that offsets any price premium popularity might otherwise generate.
A graphical representation of these relationships is shown below.
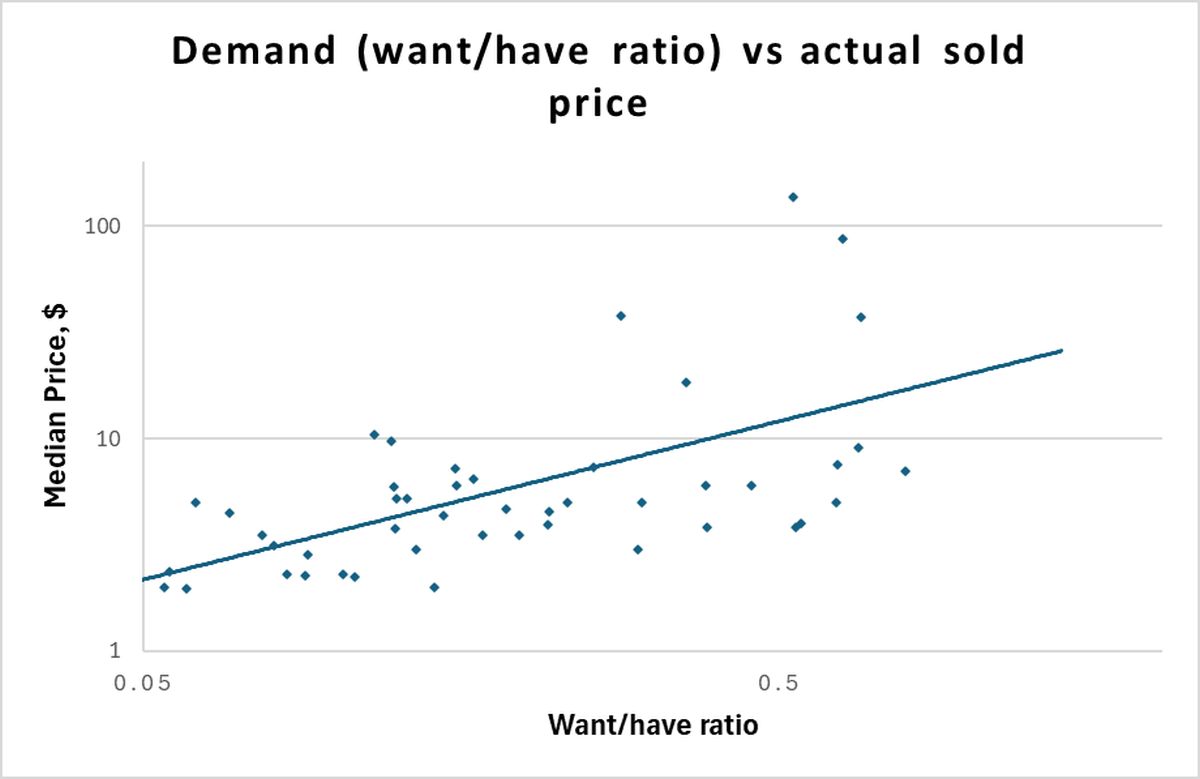
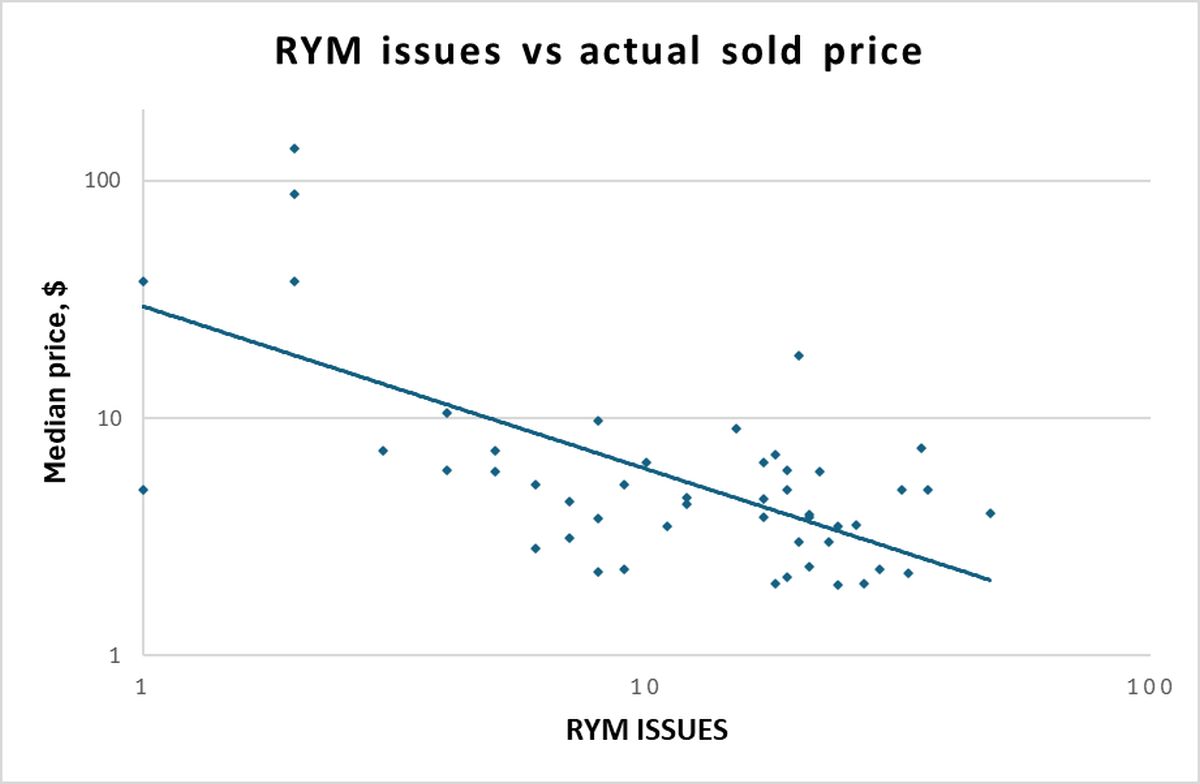
Multiple regression analysis shows that both of these variables are independently related to the sold price and remain statistically significant when considered together.
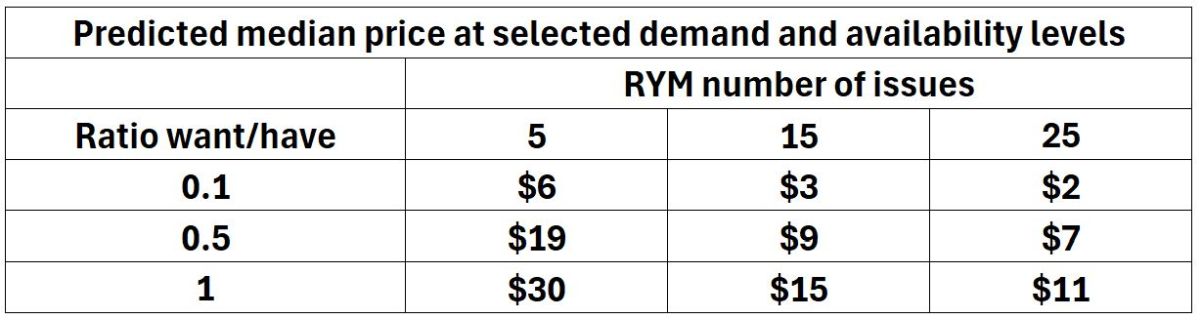
To illustrate what the graph shows in dollar terms, the table below gives approximate prices at three availability and demand levels rounded to the nearest dollar.
All the other variables mentioned show either no meaningful relationship to price or have a weaker relationship than the two main variables which suggests they act as proxies for the same underlying factors but with higher variability.
Discussion
The correlations identified here represent statistical relationships and should not be interpreted as proof of cause and effect.
The analysis reveals that CD prices generally follow the law of supply and demand. Here supply is best reflected by the long-term release history (the number of documented issues) while demand is captured by the want/have ratio. There is a key distinction to make between short-term availability which is shown by copies for sale, and long-term availability represented by number of issues. The latter likely better reflects the total number of copies in existence that can enter the market as demand increases. A graphical illustration of the relationship between RYM issues and copies for sale is shown in the appendix.
Other factors examined including album rating, artist, age of the release, and other measures of popularity, do not emerge as independent drivers of price once the demand and long-term availability is taken into account.
So why is album rating not emerging as a consistent factor? More popular albums were manufactured in higher quantities. The greater original supply appears sufficient to offset any price premium that would otherwise result for more highly rated albums.
Prices would be expected to deviate from the overall trend if an individual album’s desirability increased substantially over time, which is a less common occurrence and was not picked up in this study.
There are a small number of albums which deviate from the overall trend. These exceptions generally involve releases with additional mystique attached, or unusual release histories, such as Prince’s Black Album, which was in print for only a few weeks.
Conclusion
This analysis demonstrates that used CD prices are strongly associated with availability and demand. Albums with stronger demand and fewer documented releases tend to command higher selling prices.
In contrast, rating of an individual album is not shown to be a factor influencing selling price. The most likely explanation for this is that more highly rated albums were manufactured in larger quantities, depressing any price premium. The data shows that some individual releases deviate from the overall trend and it is suggested that this could be related to unusually low production numbers or other atypical factors not captured in the data.
The study was limited to two artists active primarily in the 1980s-1990s, and covered only studio album releases. Data was obtained in December, 2025.
Suggestions for future work
Future analysis could extend this approach to additional artists, other types of releases (for example live recordings), different eras, and a broader range of musical genres. The results could also change over time so periodically repeating the analysis might be warranted. In addition, a similar analysis could be made using other music formats, for example vinyl, for which the similar data is available. My informal observation of the vinyl market suggests results might differ, with popular albums selling for relatively high prices despite higher production numbers.
Appendix
Details of the statistical analysis
The analysis was done using JASP which is an open source statistical software package.
An Excel file was created containing the dataset described above, consisting of 50 CD titles.
The analysis was done on log transformed data for two reasons. First, most variables span a wide numerical range, and the log transformation prevents large values from dominating the results. Second, logarithmic scaling often makes curved relationships more linear, allowing the statistical methods used here to work better.
This analysis uses linear regression, and variables are included in the model based on how well they predict the response (in this case the median sold price of the CD). Following standard statistical practice, a variable is included in the model if its p-value is below 0.05. This means that if there were no real relationship then the probability of observing a relationship this strong due to random variation alone would be less than 5%. Such a result is described as statistically significant. In this study, the two variables retained in the model have p-values below 0.001, indicating the probability of observing a result of this magnitude due to random variation is extremely small.
Several methods of adding and subtracting variables from the model were attempted with the same final result each time.
The key output is shown below:
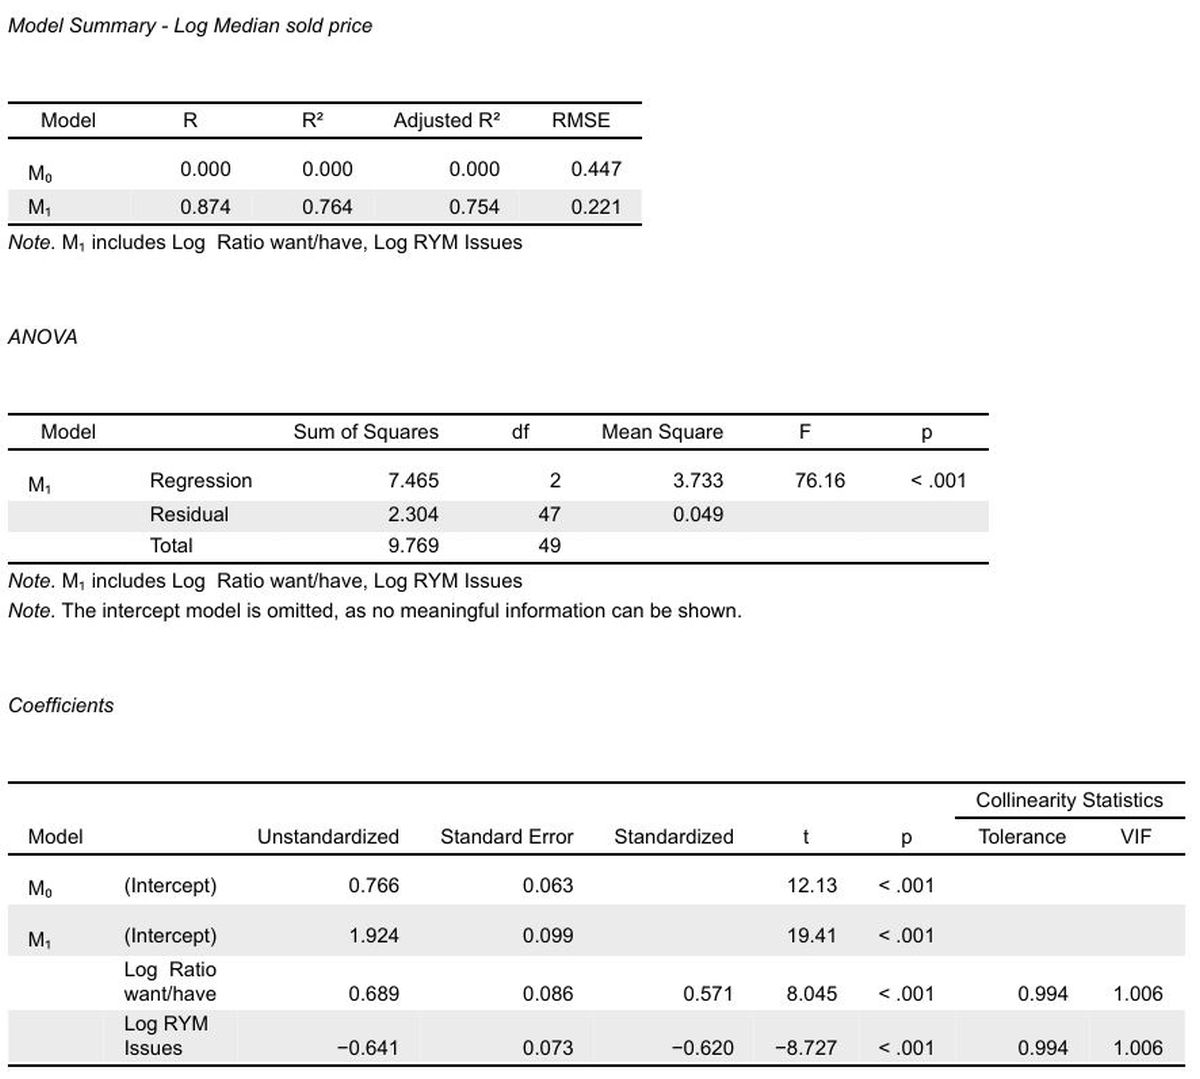
This shows the model is:
Log (Median sold price) = 1.924 + 0.689 Log (want/have ratio) -0.641 Log (RYM issues).
The adjusted model R squared is 0.754 suggesting that the model predicts about 75% of the variability in the sold price.
The low VIF values indicate that the two variables in the model are independent of each other.
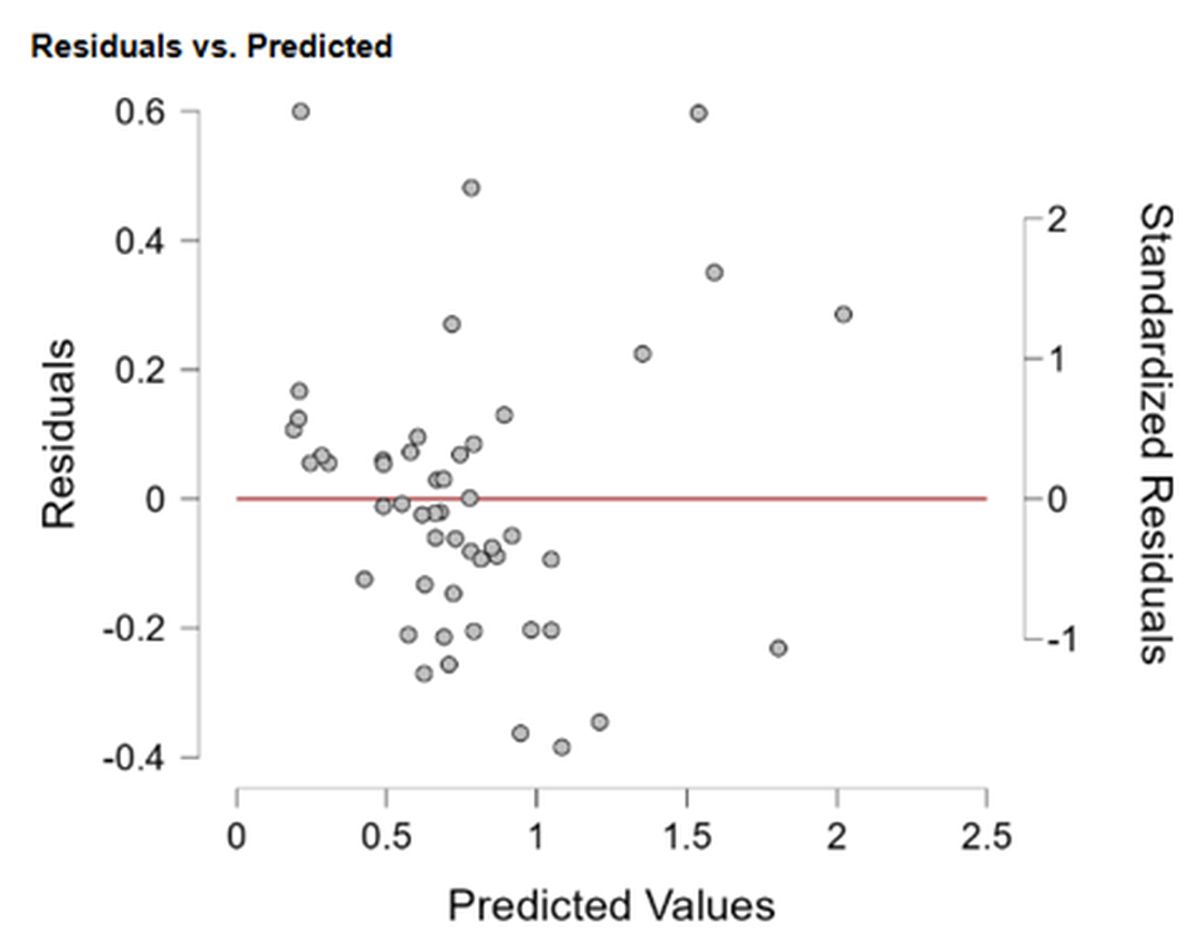
A graph of residuals vs. predicted values shows no trends indicating problems with the model:
Data table
| From Rate Your Music | From Discogs | Log transformations in final model | |||||||||||||
|---|---|---|---|---|---|---|---|---|---|---|---|---|---|---|---|
| Artist | RYM Issues | RYM rating | RYM Rating Count | RYM Review Count | Release Date | Album Age | Total have | Total want | Ratio want/have | Copies for sale | Median sold price | Log RYM Issues | Log Ratio want/have | Log Median sold price | |
| For You | Prince | 15 | 3.22 | 4237 | 88 | 1978 | 47 | 891 | 593 | 0.666 | 26 | 9 | 1.176 | -0.177 | 0.954 |
| Prince | Prince | 19 | 3.5 | 6240 | 80 | 1979 | 46 | 2127 | 963 | 0.453 | 60 | 6 | 1.279 | -0.344 | 0.778 |
| Dirty Mind | Prince | 18 | 3.81 | 10126 | 155 | 1980 | 45 | 1250 | 987 | 0.79 | 27 | 7 | 1.255 | -0.103 | 0.845 |
| Controversy | Prince | 17 | 3.65 | 6655 | 90 | 1981 | 44 | 2597 | 1381 | 0.532 | 132 | 3.83 | 1.23 | -0.274 | 0.583 |
| 1999 | Prince | 36 | 3.92 | 14023 | 184 | 1982 | 43 | 2879 | 1768 | 0.614 | 108 | 5 | 1.556 | -0.212 | 0.699 |
| Purple Rain [motion picture soundtrack] | Prince | 48 | 4.14 | 30633 | 371 | 1984 | 41 | 3978 | 2153 | 0.541 | 129 | 4 | 1.681 | -0.267 | 0.602 |
| Around the World in a Day | Prince | 32 | 3.68 | 7278 | 138 | 1985 | 40 | 1770 | 539 | 0.305 | 53 | 5 | 1.505 | -0.516 | 0.699 |
| Parade [motion picture soundtrack] | Prince | 22 | 3.77 | 6373 | 121 | 1986 | 39 | 1534 | 588 | 0.383 | 67 | 5.99 | 1.342 | -0.416 | 0.777 |
| Sign "☮︎" the Times | Prince | 35 | 4.04 | 16118 | 237 | 1987 | 38 | 1775 | 1096 | 0.617 | 64 | 7.495 | 1.544 | -0.209 | 0.875 |
| The Black Album | Prince | 20 | 3.28 | 2309 | 43 | 1987 | 38 | 2054 | 734 | 0.357 | 58 | 18.345 | 1.301 | -0.447 | 1.264 |
| Lovesexy | Prince | 17 | 3.53 | 3968 | 82 | 1988 | 37 | 2496 | 543 | 0.218 | 90 | 4.55 | 1.23 | -0.662 | 0.658 |
| Batman [motion picture soundtrack] | Prince | 19 | 3.11 | 3087 | 70 | 1989 | 36 | 3148 | 731 | 0.232 | 146 | 4.97 | 1.279 | -0.634 | 0.696 |
| Graffiti Bridge [motion picture soundtrack] | Prince | 12 | 2.96 | 1921 | 52 | 1990 | 35 | 2571 | 381 | 0.148 | 207 | 4.35 | 1.079 | -0.829 | 0.638 |
| Diamonds and Pearls | Prince | 20 | 3.42 | 3256 | 51 | 1991 | 34 | 4105 | 551 | 0.134 | 377 | 3 | 1.301 | -0.872 | 0.477 |
| O(+> [a.k.a. Love Symbol Album] | Prince | 8 | 3.48 | 2751 | 61 | 1992 | 33 | 3304 | 412 | 0.125 | 249 | 3.76 | 0.903 | -0.904 | 0.575 |
| Gold Nizza | Prince | 1 | 2.56 | 255 | 3 | 1993 | 32 | 201 | 279 | 1.388 | 4 | 202.94 | 0 | 0.142 | 2.307 |
| Come | Prince | 12 | 3.29 | 1864 | 46 | 1994 | 31 | 1605 | 299 | 0.186 | 109 | 4.65 | 1.079 | -0.73 | 0.667 |
| The Gold Experience | Prince | 10 | 3.73 | 3486 | 56 | 1995 | 30 | 2267 | 375 | 0.165 | 188 | 6.5 | 1 | -0.781 | 0.813 |
| Chaos and Disorder | Prince | 9 | 3.01 | 1289 | 45 | 1996 | 29 | 2760 | 345 | 0.125 | 187 | 5.25 | 0.954 | -0.903 | 0.72 |
| Emancipation | Prince | 7 | 3.25 | 1613 | 56 | 1996 | 29 | 3321 | 227 | 0.068 | 251 | 4.48 | 0.845 | -1.165 | 0.651 |
| Crystal Ball | Prince | 3 | 3.19 | 878 | 21 | 1998 | 27 | 842 | 215 | 0.255 | 18 | 7.31 | 0.477 | -0.593 | 0.864 |
| New Power Soul | Prince | 4 | 2.85 | 429 | 14 | 1998 | 27 | 1188 | 137 | 0.115 | 86 | 10.5 | 0.602 | -0.938 | 1.021 |
| Rave Un2 the Joy Fantastic | Prince | 6 | 2.71 | 971 | 20 | 1999 | 26 | 2420 | 220 | 0.091 | 206 | 2.825 | 0.778 | -1.041 | 0.451 |
| Rave In2 the Joy Fantastic [remixes] | Prince | 2 | 2.94 | 250 | 5 | 2001 | 24 | 589 | 310 | 0.526 | 20 | 136.76 | 0.301 | -0.279 | 2.136 |
| The Rainbow Children | Prince | 8 | 3.43 | 1280 | 41 | 2001 | 24 | 2906 | 357 | 0.123 | 161 | 9.725 | 0.903 | -0.911 | 0.988 |
| One Nite Alone... Solo Piano and Voice by Prince | Prince | 2 | 3.28 | 589 | 8 | 2002 | 23 | 597 | 375 | 0.628 | 7 | 87.5 | 0.301 | -0.202 | 1.942 |
| N·E·W·S | Prince | 2 | 3 | 743 | 21 | 2003 | 22 | 2081 | 588 | 0.283 | 45 | 37.765 | 0.301 | -0.549 | 1.577 |
| Musicology | Prince | 9 | 3.35 | 1861 | 59 | 2004 | 21 | 3485 | 294 | 0.084 | 323 | 2.3 | 0.954 | -1.074 | 0.362 |
| 3121 | Prince | 8 | 3.34 | 1737 | 52 | 2006 | 19 | 1553 | 140 | 0.09 | 115 | 2.26 | 0.903 | -1.045 | 0.354 |
| Planet Earth | Prince | 7 | 2.93 | 1153 | 32 | 2007 | 18 | 1322 | 106 | 0.08 | 117 | 3.12 | 0.845 | -1.096 | 0.494 |
| Lotusflow3r / MPLSound / Elixer | Prince | 1 | 3.07 | 493 | 12 | 2009 | 16 | 3429 | 207 | 0.06 | 125 | 5 | 0 | -1.219 | 0.699 |
| Art Official Age | Prince | 6 | 3.13 | 1158 | 19 | 2014 | 11 | 933 | 121 | 0.13 | 20 | 5.25 | 0.778 | -0.887 | 0.72 |
| Plectrumelectrum | Prince | 5 | 2.88 | 748 | 8 | 2014 | 11 | 788 | 122 | 0.155 | 12 | 7.25 | 0.699 | -0.81 | 0.86 |
| HITnRUN Phase One | Prince | 5 | 2.75 | 717 | 10 | 2015 | 10 | 1090 | 135 | 0.124 | 36 | 5.96 | 0.699 | -0.907 | 0.775 |
| HITNRUN Phase Two | Prince | 4 | 3.42 | 821 | 17 | 2015 | 10 | 1523 | 237 | 0.156 | 77 | 6 | 0.602 | -0.808 | 0.778 |
| Murmur | R.E.M. | 23 | 3.88 | 20751 | 359 | 1983 | 42 | 2777 | 834 | 0.3 | 63 | 3 | 1.362 | -0.522 | 0.477 |
| Reckoning | R.E.M. | 21 | 3.82 | 11341 | 175 | 1984 | 41 | 1828 | 703 | 0.385 | 45 | 3.85 | 1.322 | -0.415 | 0.585 |
| Fables of the Reconstruction | R.E.M. | 24 | 3.66 | 7812 | 146 | 1985 | 40 | 2727 | 533 | 0.195 | 54 | 3.49 | 1.38 | -0.709 | 0.543 |
| Lifes Rich Pageant | R.E.M. | 21 | 3.82 | 9593 | 157 | 1986 | 39 | 2507 | 542 | 0.216 | 63 | 3.92 | 1.322 | -0.665 | 0.593 |
| Document | R.E.M. | 26 | 3.72 | 10914 | 165 | 1987 | 38 | 4399 | 751 | 0.171 | 132 | 3.53 | 1.415 | -0.768 | 0.548 |
| Green | R.E.M. | 29 | 3.55 | 9080 | 172 | 1988 | 37 | 6308 | 650 | 0.103 | 179 | 2.3 | 1.462 | -0.987 | 0.362 |
| Out of Time | R.E.M. | 33 | 3.51 | 12443 | 229 | 1991 | 34 | 9834 | 1059 | 0.108 | 314 | 2.24 | 1.519 | -0.968 | 0.35 |
| Automatic for the People | R.E.M. | 27 | 3.86 | 22613 | 375 | 1992 | 33 | 9831 | 1412 | 0.144 | 341 | 2 | 1.431 | -0.843 | 0.301 |
| Monster | R.E.M. | 24 | 3.36 | 7953 | 218 | 1994 | 31 | 8817 | 516 | 0.059 | 454 | 1.98 | 1.38 | -1.233 | 0.297 |
| New Adventures in Hi-Fi | R.E.M. | 21 | 3.65 | 6794 | 157 | 1996 | 29 | 5407 | 298 | 0.055 | 190 | 2.375 | 1.322 | -1.259 | 0.376 |
| Up | R.E.M. | 19 | 3.25 | 4850 | 133 | 1998 | 27 | 3436 | 171 | 0.05 | 132 | 2.14 | 1.279 | -1.303 | 0.33 |
| Reveal | R.E.M. | 18 | 3.14 | 4340 | 120 | 2001 | 24 | 3927 | 212 | 0.054 | 167 | 2 | 1.255 | -1.268 | 0.301 |
| r.e.m.IX [remixes] | R.E.M. | 1 | 2.32 | 60 | 2 | 2002 | 23 | 101 | 68 | 0.673 | 7 | 37.5 | 0 | -0.172 | 1.574 |
| Around the Sun | R.E.M. | 11 | 2.58 | 3374 | 120 | 2004 | 21 | 1959 | 151 | 0.077 | 79 | 3.49 | 1.041 | -1.113 | 0.543 |
| Accelerate | R.E.M. | 17 | 3.24 | 3879 | 157 | 2008 | 17 | 2721 | 125 | 0.046 | 86 | 6.5 | 1.23 | -1.338 | 0.813 |